


Views: 0 Author: Site Editor Publish Time: 2026-10-11 Origin: Site


Marketing brochures for commercial HVAC equipment prominently display peak efficiency ratings. Mechanical engineers and facility directors know buildings do not operate in perpetual laboratory conditions. Relying on nominal capacity ratings when selecting equipment leads to critically undersized central plants. This oversight forces an over-reliance on expensive backup electric resistance heating and guarantees a failure to meet winter heating loads.
To mitigate operational risk and ensure accurate lifecycle modeling, specifiers must bypass marketing claims. You must interrogate manufacturer performance tables directly. This guide deconstructs how to read standard rating points, calculate true design-point capacity, and evaluate equipment based on verified engineering data. We focus on the technical realities of hydronic heating to ensure your next installation actually performs when the temperature drops.
Nominal vs. Actual: The standard A7/W35 rating (7°C air, 35°C water) represents ideal conditions; it is a baseline for comparison, not a metric for winter load sizing.
Capacity Degradation: As ambient air temperatures drop and required leaving water temperatures (LWT) rise (e.g., A-7/W55), heat pump capacity decreases while power input increases.
Efficiency Metrics: COP provides a snapshot of efficiency at a specific temperature node, whereas SCOP offers a weighted, seasonal average necessary for accurate ROI calculations.
Design-Point Sizing: Equipment must be evaluated at the facility's specific winter design temperature, terminal unit water temperature requirements, and required hydronic flow rates to guarantee performance.
System Integration: Identifying the bivalent point on performance curves is critical for sizing hybrid systems where heat pumps operate alongside backup boilers.
Manufacturer data sheets are dense and often feature inconsistent formatting across different brands. Understanding the standardized nomenclature is your first step in technical evaluation. You cannot size a central plant without knowing exactly what the numbers on the page represent. When you open a technical submittal, you usually see a matrix of temperatures, flow rates, and electrical data.
Performance tables use a standard "A" and "W" format. "A" stands for Ambient Air Temperature. "W" stands for Leaving Water Temperature (LWT). The numbers following these letters indicate the specific temperatures in degrees Celsius used during the laboratory test.
The A7/W35 baseline represents 7°C (44.6°F) ambient air and 35°C (95°F) leaving water. This is the industry standard for marketing. It demonstrates maximum efficiency because the temperature lift is minimal. These conditions are perfect for low-temperature radiant floor systems operating during mild autumn weather. However, this rating is useless for sizing equipment meant to survive a harsh winter.
The A-7/W55 stress test represents -7°C (19.4°F) ambient air and 55°C (131°F) leaving water. This metric reflects realistic retrofit conditions. Many older buildings utilize existing high-temperature terminal units like traditional cast-iron radiators or older fan coils. Pushing water to 55°C when the outside air is well below freezing forces the compressor to work exceptionally hard. This reveals the true capability of the machine.
Heating Capacity, measured in kilowatts (kW) or thousands of British Thermal Units per hour (MBH), is the actual thermal energy delivered to the building. Power Input, measured in kW, is the electrical energy consumed by the compressor, condenser fans, and integrated circulation pumps.
There is a strict inverse relationship between these two metrics. As ambient temperatures drop, there is less ambient thermal energy available to extract. The machine must work harder to compress the refrigerant and achieve the target water temperature. This dynamic simultaneously reduces heating capacity and increases power input. Understanding the relationship between heat pump capacity and power input prevents catastrophic undersizing during the design phase. If you ignore this curve, you will end up with a freezing building and tripped breakers.
Capacity ratings do not exist in a vacuum. They are contingent upon maintaining specific water flow rates, measured in gallons per minute (GPM) or liters per second (L/s). The system must also maintain a designed temperature differential (Delta T) across the heat exchanger. If the flow rate drops, the heat transfer efficiency plummets.
Performance tables include pressure drop data. This information dictates the resistance the water faces as it moves through the internal heat exchanger. You must read this data carefully to ensure the existing facility circulation pumps are adequately sized to overcome this resistance. If the pumps are too small, the unit will trip on low-flow alarms. We see this constantly in the field when contractors reuse old boiler pumps without checking the new pressure drop requirements.
Rating Point | Ambient Air (°C) | Leaving Water (°C) | Heating Capacity (kW) | Power Input (kW) | COP | Typical Application |
|---|---|---|---|---|---|---|
A7/W35 | 7 | 35 | 100.0 | 22.2 | 4.50 | Radiant floors in mild weather |
A2/W45 | 2 | 45 | 85.5 | 26.7 | 3.20 | Modern fan coils in cool weather |
A-7/W55 | -7 | 55 | 65.0 | 31.0 | 2.09 | Legacy radiators in freezing weather |
A-15/W55 | -15 | 55 | 48.0 | 33.1 | 1.45 | Extreme cold climate retrofits |
Evaluating equipment requires distinguishing between instantaneous efficiency and long-term operational efficiency. Financial models built on instantaneous peak efficiency will fail to project real-world operating costs accurately.
COP is the ratio of heating capacity to power input at a strict, static condition. If a unit delivers 100 kW of heat and consumes 25 kW of electricity, the COP is 4.0. You will see this listed as COP at A2/W45 or similar specific nodes.
The limitation of COP is its static nature. It only represents performance at one specific hour of one specific day under laboratory-controlled humidity and airflow. It does not account for weather fluctuations, defrost cycles, or part-load operation. Relying solely on COP gives a distorted view of seasonal performance. It is a snapshot, not a movie.
SCOP integrates temperature bin data across a defined heating season. It calculates the total expected thermal energy output over the year divided by the total expected electrical energy consumption. This metric uses regional climate data to weight the efficiency based on how many hours the unit will actually spend at various ambient temperatures.
Engineers use COP and SCOP together for different calculations. COP is used for sizing electrical infrastructure at peak load conditions. You need the lowest possible COP value at the coldest design temperature to size the breakers and wire gauges. SCOP is used for annual energy cost projections and carbon reduction calculations.
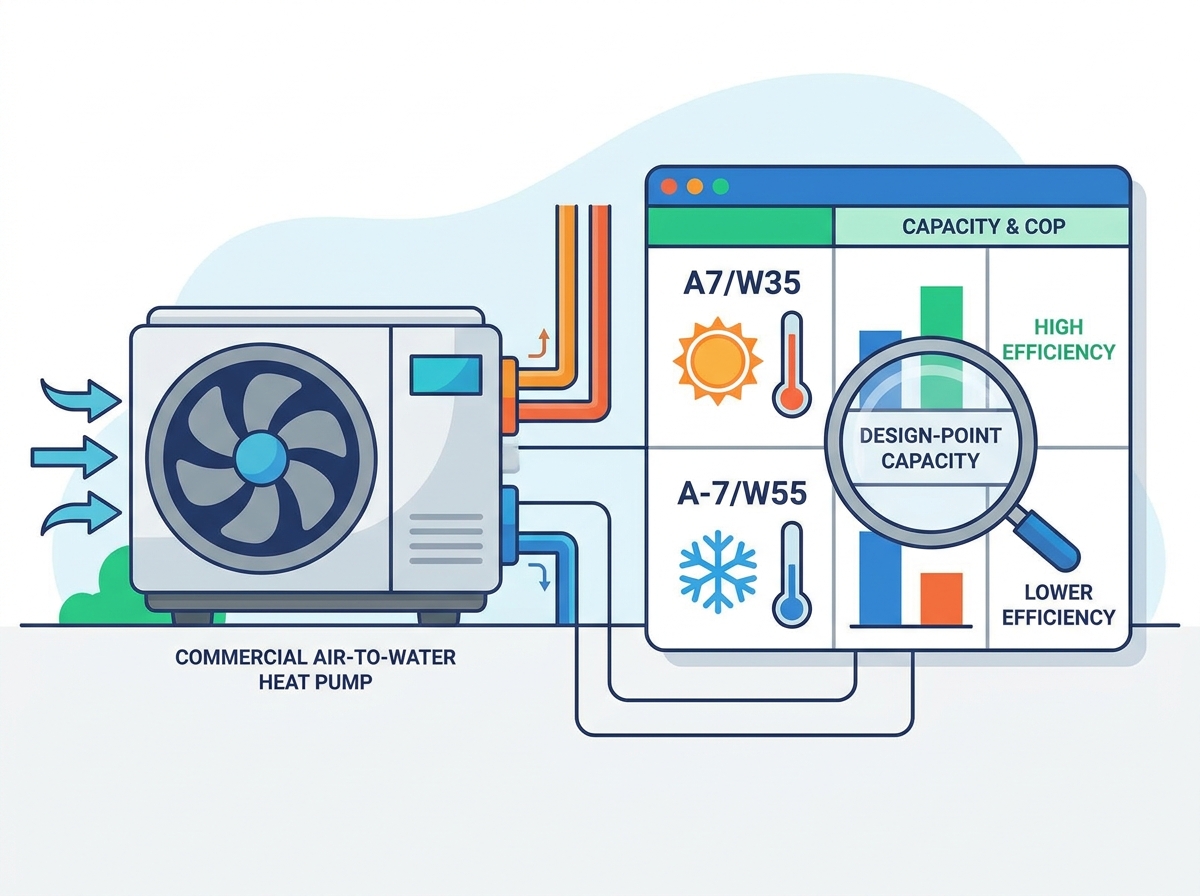
Implementation risks run high during commercial electrification retrofits. The most common point of failure is selecting a commercial air-to-water heat pump based on its nominal brochure rating rather than its design-point capability.
Sizing a central plant based on A7/W35 data results in a plant that fails when ambient temperatures approach freezing. A unit rated for 100 kW at 7°C might only produce 60 kW at -10°C. If your building requires 100 kW of heat at -10°C, you are severely undersized.
Generating higher water temperatures for legacy hydronic systems introduces a massive thermal penalty. Older buildings with cast-iron radiators were designed around boilers delivering 80°C (176°F) water. Forcing a compressor to push water to 55°C or 60°C drastically cuts its heating capacity. The A7/W35 rating completely ignores this high-lift penalty. We have seen entire retrofits fail because the design engineer assumed the nominal capacity would hold steady across the temperature spectrum.
Manufacturer performance curves map ambient temperature on the X-axis against heating capacity on the Y-axis. As you trace the line from right (warm) to left (cold), the capacity curve drops. You must overlay your building's heat loss curve onto this chart. The building's heat loss increases as the temperature drops.
The intersection of the declining equipment capacity curve and the increasing building heat loss curve is the balance point. Below this specific ambient temperature, the unit cannot heat the building alone.
For hybrid systems, this intersection defines the bivalent point. This is the exact temperature node where the primary equipment requires supplemental heat from a backup boiler. Identifying the bivalent point dictates how large the backup boiler must be and at what outdoor temperature the building automation system should trigger the boiler to fire.
Moving from standardized tables to site-specific engineering guarantees a successful installation. You must calculate the exact capacity required for your specific geographic location and building infrastructure.
You must utilize ASHRAE 99% or 99.6% design conditions for your specific geographic location. These figures represent the lowest temperatures the location experiences for 99% or 99.6% of the hours in a year. This establishes the absolute worst-case ambient air temperature the unit must endure.
Do not use record-low temperatures, as this leads to massive oversizing. Oversized equipment short-cycles during mild weather, destroying compressor lifespan. Stick to the ASHRAE 99.6% data to balance reliability with equipment longevity.
Assess the existing building's hydronic distribution network. Different terminal units require drastically different water temperatures to output their rated heat. Traditional fin-tube baseboards might need 140°F (60°C). Modern radiant floor slabs might only need 105°F (40°C).
Calculate the required LWT at the winter design temperature. Implement an outdoor reset curve. This control strategy lowers the target water temperature as the outdoor air gets warmer. Operating at lower water temperatures whenever possible significantly improves the seasonal efficiency of the central plant.
Your exact design conditions will rarely match the neat columns in a manufacturer's brochure. Your ASHRAE 99.6% temperature might be -4°C, and your required LWT might be 48°C. You must extract the exact capacity and power input for A-4/W48.
This requires interpolating data between the published rating nodes. You look at the performance at A-7/W45, A-7/W55, A2/W45, and A2/W55 to calculate the precise output at your target condition. Reputable manufacturers provide selection software that performs this interpolation automatically, outputting a customized performance report for your specific site.
Technical realities in the field often degrade or alter table-rated performance. Engineers must account for these hidden variables to prevent unexpected capacity shortfalls during mid-winter operation.
Coil frosting occurs primarily between 0°C and 5°C (32°F to 41°F) ambient conditions. In this temperature band, the air holds significant moisture, and the evaporator coil is operating below freezing. Moisture condenses and freezes on the fins, blocking airflow and insulating the heat exchanger.
The unit must initiate a reverse-cycle defrost process to melt this ice. It temporarily switches into cooling mode, taking heat from the building's water loop and sending it to the outdoor coil. This process temporarily halts heating and consumes energy. It reduces the integrated heating capacity compared to the instantaneous table capacity. If a table says the unit produces 100 kW at A2/W45, the integrated capacity accounting for defrost might only be 85 kW. Installing properly sized buffer tanks prevents this cold water from reaching the terminal units during the defrost cycle.
Commercial buildings rarely operate at peak design conditions. They spend most of the heating season at 50% or 75% load. You must evaluate performance tables at these part-load conditions, not just at 100% full load.
Variable speed (inverter) compressors excel here. They slow down their rotation to match the exact building load. Operating at lower speeds increases the surface area ratio of the heat exchangers relative to the refrigerant flow. This maintains a high COP during milder shoulder-season weather, drastically reducing annual operating costs.
The chemical properties of the refrigerant dictate the maximum LWT and capacity retention at low ambient temperatures. Legacy R410A systems struggle to produce water above 45°C when the outdoor air drops below freezing. Their capacity curves fall off a cliff at A-7.
Performance tables for R290 (propane) units show significantly less capacity degradation at A-7/W55. R290 has excellent thermodynamic properties, allowing it to achieve 70°C water temperatures even in sub-zero weather. R32 offers a middle ground, providing better low-ambient performance than R410A but falling short of R290's high-temperature capabilities.
Refrigerant Type | GWP (Global Warming Potential) | Max Leaving Water Temp (°C) | Low Ambient Capacity Retention | Primary Application |
|---|---|---|---|---|
R410A | 2088 | 50 - 55 | Poor | Legacy systems, mild climates |
R32 | 675 | 60 - 65 | Moderate | Modern new builds, moderate climates |
R290 (Propane) | 3 | 70 - 75 | Excellent | High-temp retrofits, severe cold climates |
Ensuring vendor accountability requires demanding complete data transparency. Do not accept simplified brochures. You must request comprehensive engineering data to validate the equipment's suitability for your project.
Demand comprehensive performance tables covering ambient temperatures from -20°C to 15°C, at leaving water temperatures from 35°C to 60°C. If the manufacturer refuses to provide data below 0°C, disqualify the equipment.
Request integrated capacity data that explicitly accounts for defrost cycle penalties. Instantaneous capacity numbers will leave your building cold during heavy frost conditions.
Require acoustic performance data mapped to design-point conditions. Compressors and fans run significantly louder at lower ambient temperatures because they are operating at maximum RPM to extract heat. Sound power levels at A-7/W55 will be much higher than at A7/W35. You need this data to comply with local noise ordinances.
Never trust self-reported performance data without verification. Demand AHRI (Air-Conditioning, Heating, and Refrigeration Institute) or Eurovent certification. These independent bodies test the equipment in certified laboratories to validate the published performance tables. If a unit lacks third-party certification, the published COP and capacity figures are highly suspect.
A central heating plant is only as effective as the engineering rigor applied to its selection. Nominal ratings are marketing tools designed to sell units in mild climates. Performance tables are engineering tools designed to guarantee building comfort in severe weather. When comparing multiple units, discard the A7/W35 baseline entirely. Shortlist equipment based strictly on its capacity, COP, and power draw at your facility's specific winter design-point, such as A-7/W55. This approach eliminates underperforming equipment early in the design phase.
Calculate your exact ASHRAE 99.6% winter design temperature and required leaving water temperature based on existing terminal units.
Require manufacturers to provide customized selection software outputs based on your specific site conditions rather than generic brochure data.
Verify that the submitted capacity data is integrated, explicitly accounting for defrost cycle penalties during near-freezing weather.
Identify the exact bivalent point on the performance curve to properly size any required backup boiler systems.
A: It denotes a testing condition of 7°C ambient air and 35°C leaving water. It is the industry standard for nominal capacity and peak efficiency, but rarely reflects peak winter heating conditions.
A: As ambient air temperature drops, there is less ambient heat to extract. The compressor must work harder, increasing power input, to deliver less total thermal energy, which decreases capacity.
A: COP measures efficiency at one specific temperature condition. SCOP averages efficiency across an entire heating season using regional climate data to provide a realistic view of annual energy consumption.
A: A-7/W55 simulates a cold winter day requiring high-temperature water. This condition is typical when retrofitting equipment into buildings with legacy boilers and traditional cast-iron radiators.
A: The bivalent point is the specific outdoor temperature at which the equipment's maximum heating capacity exactly matches the building's heat loss. Below this temperature, a supplemental heating source must activate.
A: You must cross-reference your building's winter design temperature and required leaving water temperature against the manufacturer's extended performance tables or use their proprietary selection software.
A: Standard instantaneous capacity tables often do not. Engineers must specifically request integrated capacity data, which factors in the thermal and electrical penalties of the defrost cycle at near-freezing temperatures.


